Skills Used
- Python
- Data Science
- Pandas
Source Code
GitHubIntroduction
League of Legends is one of the most popular esports video games in the world with some players making millions of dollars. Players of League of Legends, or LoL for short, earn this money by professionally competing, or by streaming on sites like Twitch and Youtube. LoL is a complex game that requires continuous improvement and learning. While I do not professionally compete nor stream, I do play this game regularly. One of the most satisfying parts of this game is watching yourself grow into a better player overtime. My goal is to see how I can improve my gameplay so that I can get that satisfaction. Even though I have no goal to become a competitor or streamer, it is possible that with improvement I could unlock those doors. Also, the conclusions I draw here can be applied to the game as a whole and help other players of my skill level improve as well. While most players would simply go back and watch their old games to see points of improvement, I choose to statistically analyze my gameplay on a large scale to get a solid understanding of my gameplay.
Introduction
The central question to this data analysis is: what components of my League of Legends gameplay contribute to getting more assists? Players of LoL may find the question odd in asking about assists rather than kills or wins. However, in this case it is warranted considering I primarily play the role of support. Players of this role will often quantify their skill by how many assists they get during a game. Therefore, I will be using assists as my dependent variable for this analysis.Data Collection
For this analysis, I chose to use the Riot Games API which has a plethora of data that can be collected. Through this API, one may gather information on any of Riot’s games, and for this case, the LoL API calls will be used. A python notebook will be used to do this analysis which will utilize Riot Watcher, a wrapper library for the Riot Games API. The rst thing I did was get my PUUID on the Riot Games API. This is a string that is used to identify players that is only used for the API. With that, I used the ‘matchlist by puuid’ call to get my last 100 matches. While 100 matches may not sound like enough, it should be plenty for this analysis. More matches would analyze my performance 100 matches ago which is vastly dierent than now and would hinder the reliability of the data. With those matches, I used the ‘match by id’ call to get the data from all of those matches. This resulted in 100 matches, however, it may include game modes that I am uninterested in investigating. This analysis focuses on the classic game mode as that is the most popular and important gamemode. Therefore, any matches that weren’t classic were ltered out. This left 74 classic matches to analyze. There should be plenty of matches to represent my current playstyle. I then checked the top and bottom of the data and immediately noticed the incredible number of columns. After looking through the column values, it was no mistake, the API simply gave a large number of data points. To clean the data, I removed any of these columns that weren’t important to understanding my gameplay. I then checked to ensure that the assists column was accurate and that the data made sense. After this, the data should be clean, accurate, and ready to be used. To prevent needing to call the API again, I exported this data to a Github Repository.
Analysis
To answer the primary question, my goal is to create a fairly accurate linear regression model based on the data provided. In order to do this, I will be analyzing the data and whittling down the data to the most helpful points for the regression model. While doing this, I will account for the various linear regression assumptions.
I began by plotting out all of the variables that seemed to be the most important on a histogram in order to get an idea of the data’s distribution.
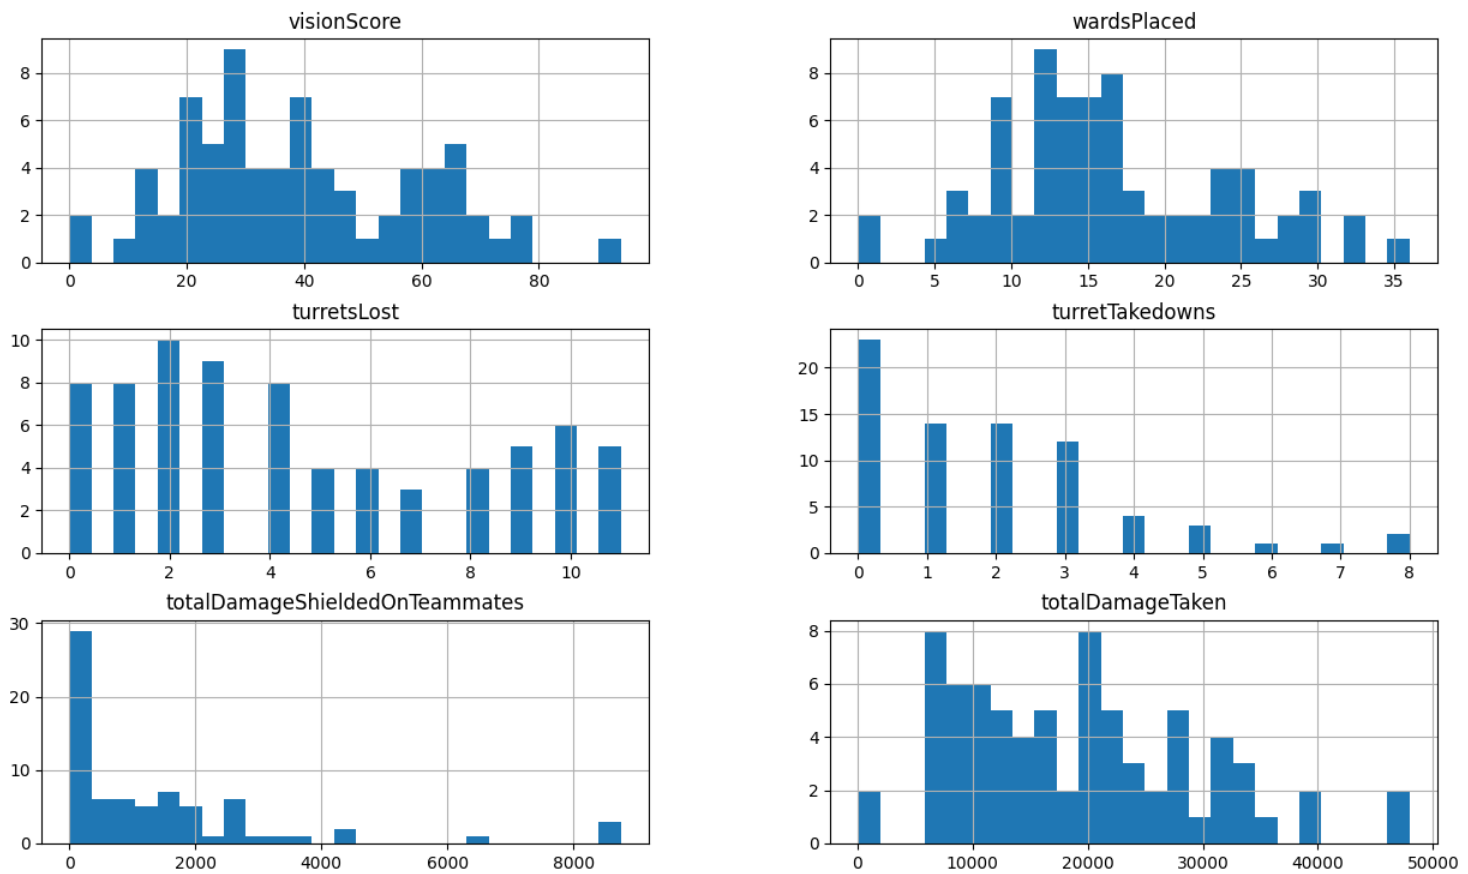
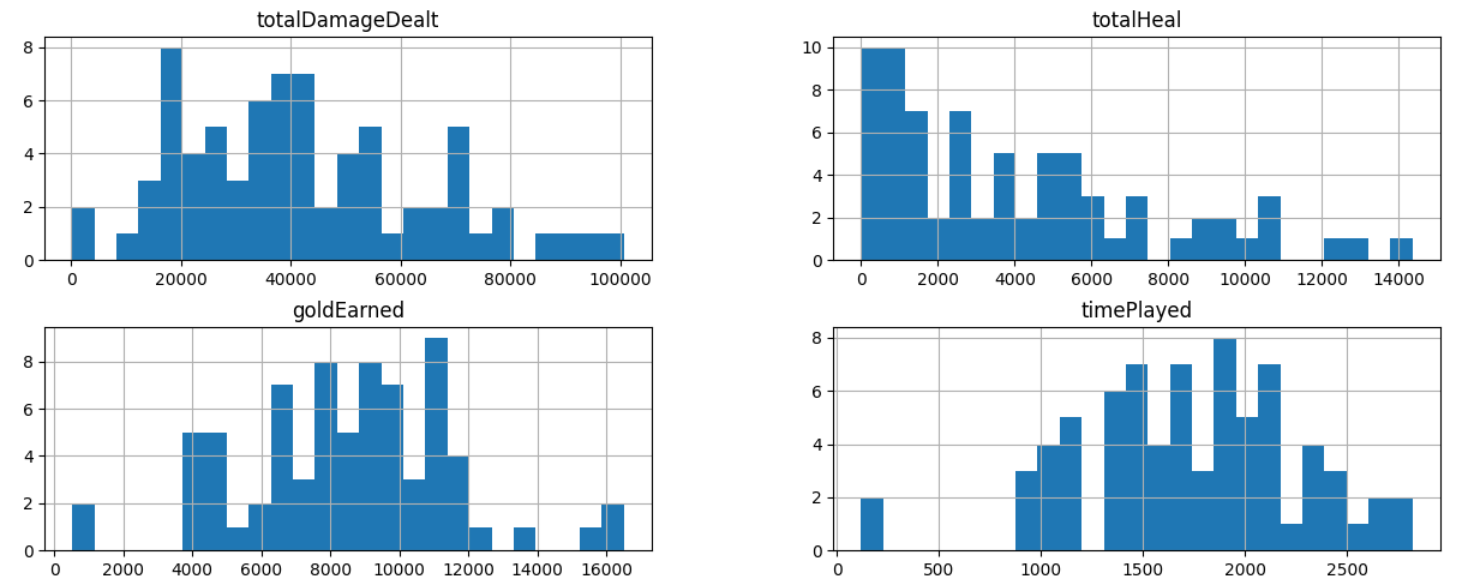 These 10 variables, through my understanding of the game, should have the most impact on the number of assists I get. For linear regression, one of the assumptions is that the data is evenly distributed. Only six variables out of the ten are relatively evenly distributed: vision score, wards placed, total damage taken, total damage dealt, goal earned, and time played. The variables turrets lost, and turret takedowns don’t have any sort of distribution and should be omitted. The variables total heal and total shield on teammates are incredibly left leaning. This is reasonable as I do not play a champion that heals or shields every game. Therefore, only a few of those data points would be accurate so those variables will be omitted as well.
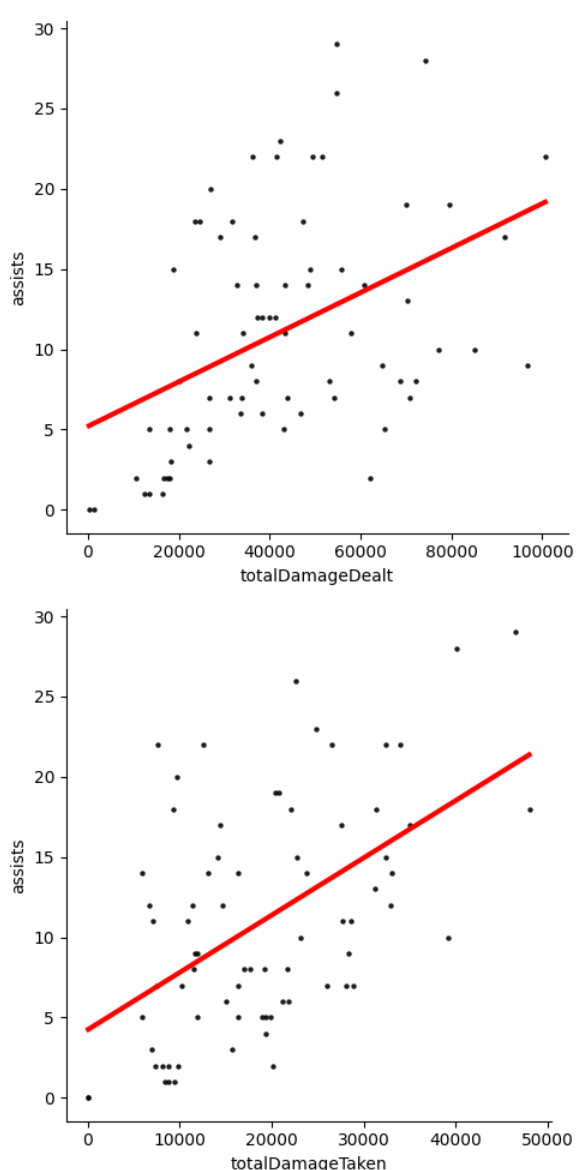
Then, I needed to check if the variables have a linear relationship with assists. This is important because linear regression assumes a linear relationship. I began plotting all of the variables on a scatter plot against assists (Fig 3). Luckily, upon initial inspection all of the variables seem to have a linear relationship. The relationships don’t look incredibly strong, but there is moderate linearity. This gure does show that there may be a possibility for multicollinearity which will be further investigated later. Another one of the assumptions is no heteroskedasticity. From looking at the data in (Fig 3) there doesn’t seem to be heteroskedasticity for any of the data points.
These 10 variables, through my understanding of the game, should have the most impact on the number of assists I get. For linear regression, one of the assumptions is that the data is evenly distributed. Only six variables out of the ten are relatively evenly distributed: vision score, wards placed, total damage taken, total damage dealt, goal earned, and time played. The variables turrets lost, and turret takedowns don’t have any sort of distribution and should be omitted. The variables total heal and total shield on teammates are incredibly left leaning. This is reasonable as I do not play a champion that heals or shields every game. Therefore, only a few of those data points would be accurate so those variables will be omitted as well.
Then, I needed to check if the variables have a linear relationship with assists. This is important because linear regression assumes a linear relationship. I began plotting all of the variables on a scatter plot against assists (Fig 3). Luckily, upon initial inspection all of the variables seem to have a linear relationship. The relationships don’t look incredibly strong, but there is moderate linearity. This gure does show that there may be a possibility for multicollinearity which will be further investigated later. Another one of the assumptions is no heteroskedasticity. From looking at the data in (Fig 3) there doesn’t seem to be heteroskedasticity for any of the data points.
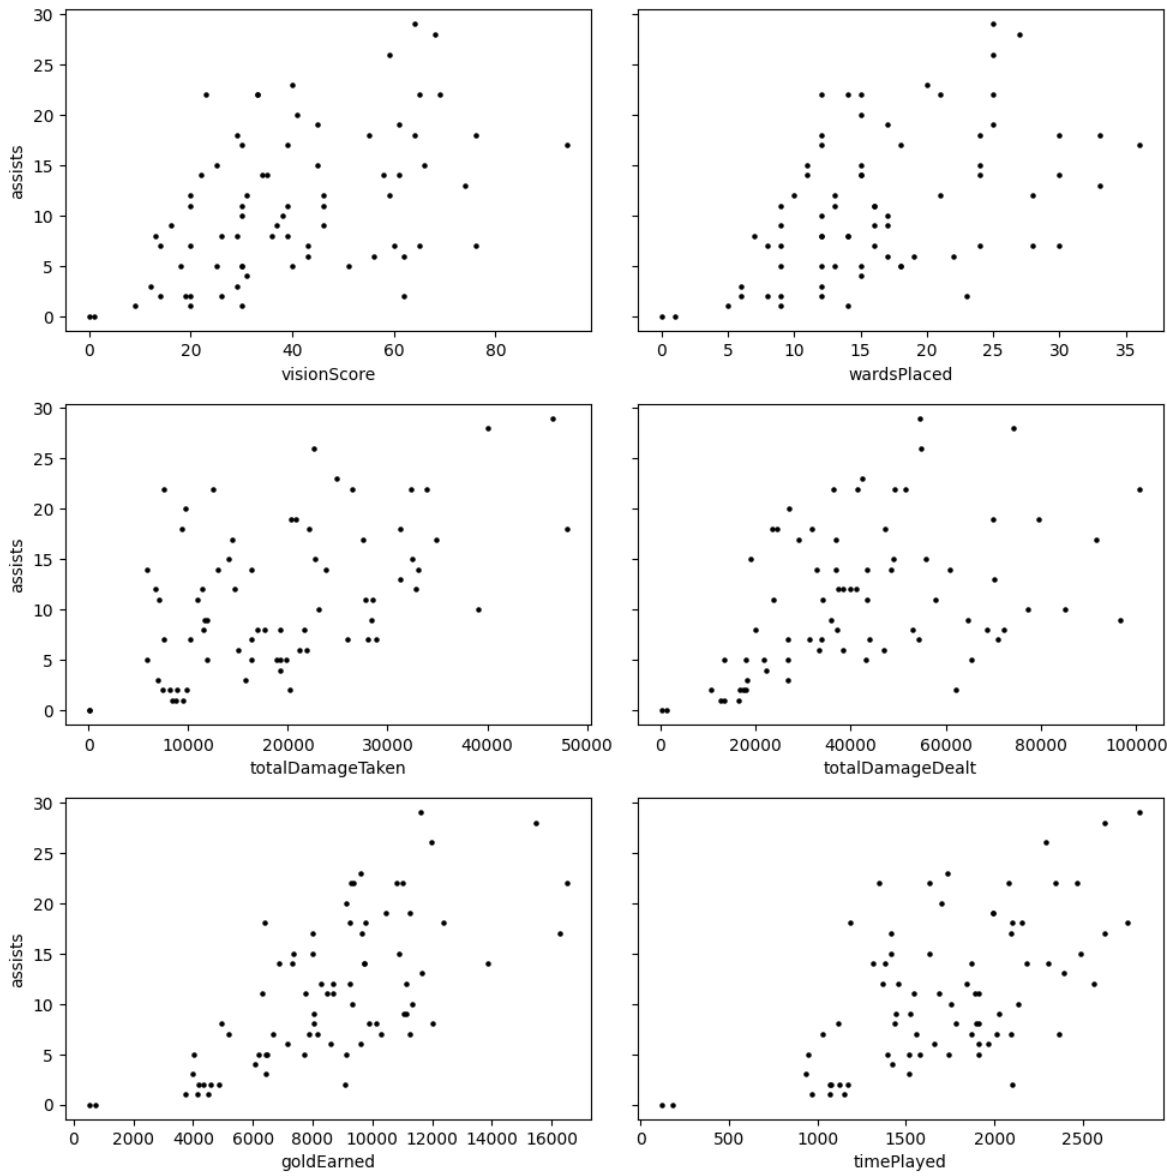 These plots helped to validate some of the linear regression assumptions. None of these variables, so far, need to be omitted due to failing assumptions. To be sure, All of these variables were plotted using Seaborn’s ‘lmplots.’ (Fig 4)
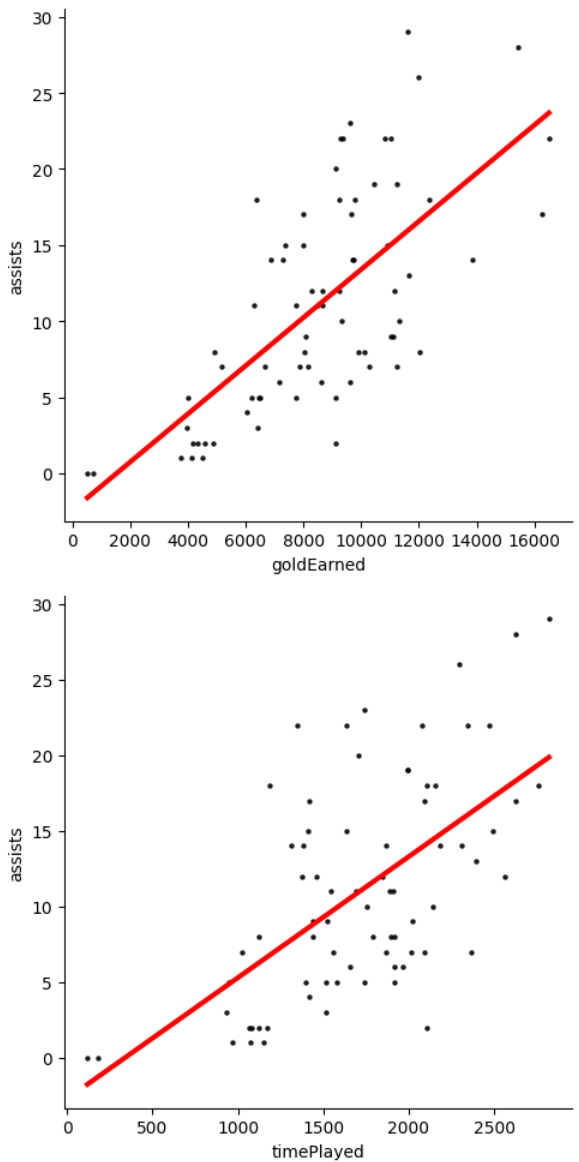
 All of the variables look to have a strong enough linear relationship to be used in the linear regression model. Furthermore, most of the linear regression assumptions have been addressed. The next linear regression assumption to be addressed is multicollinearity. Most likely this dataset has some multicollinearity due to the nature of how close the games are time wise as well as how similar games tend to be. For this analysis I will allow multicollinearity as its impact shouldn’t be too negative. Furthermore, it would be nearly impossible to avoid multicollinearity with this dataset. I will not use transformations on the dataset to address the multicollinearity but rather take it as a potential weakness to the conclusion.
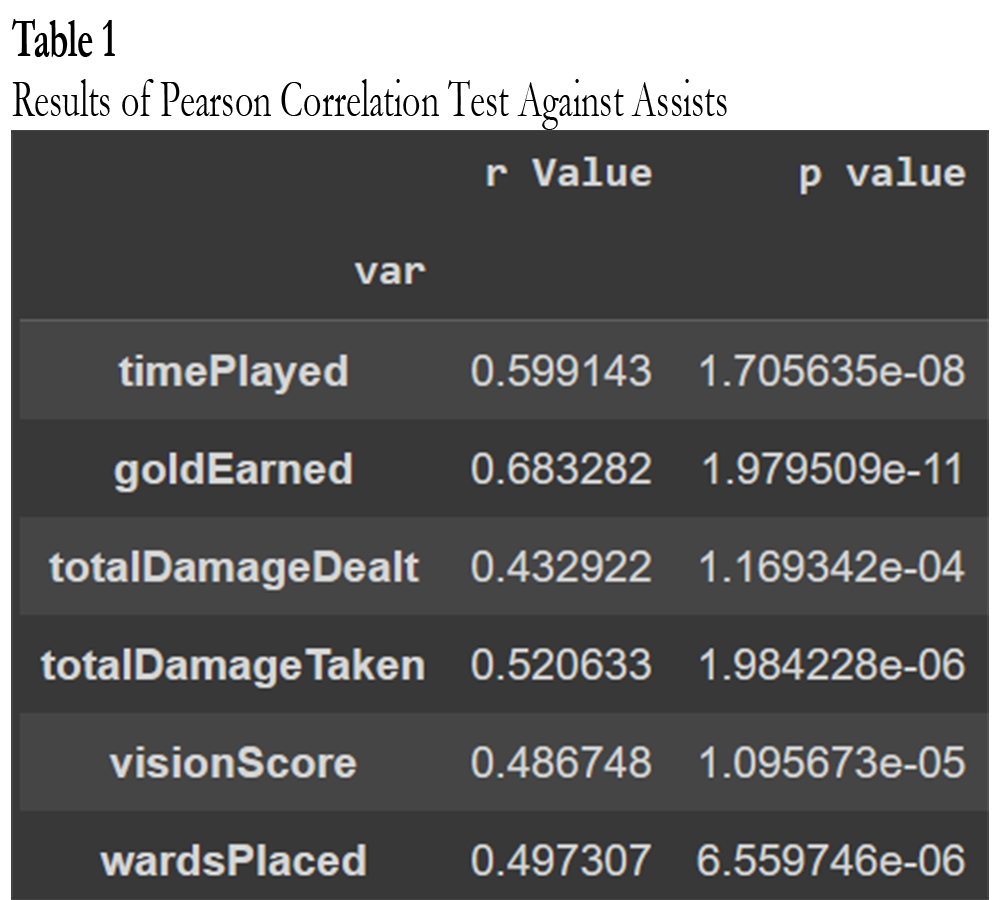
Now that the data has been reduced to the data points that could possibly work in a linear regression model, a Pearson Correlation Coefficient test will be applied to all of the data points against ‘assists.’ This is to understand if there is some statistical importance to the correlations. Given the correlation heatmap from earlier, there will most likely be a statistical importance, however, it is still important to verify. After the tests, I created a table with the r and p values of the variables against assists (Table 1)
All of the variables look to have a strong enough linear relationship to be used in the linear regression model. Furthermore, most of the linear regression assumptions have been addressed. The next linear regression assumption to be addressed is multicollinearity. Most likely this dataset has some multicollinearity due to the nature of how close the games are time wise as well as how similar games tend to be. For this analysis I will allow multicollinearity as its impact shouldn’t be too negative. Furthermore, it would be nearly impossible to avoid multicollinearity with this dataset. I will not use transformations on the dataset to address the multicollinearity but rather take it as a potential weakness to the conclusion.
Now that the data has been reduced to the data points that could possibly work in a linear regression model, a Pearson Correlation Coefficient test will be applied to all of the data points against ‘assists.’ This is to understand if there is some statistical importance to the correlations. Given the correlation heatmap from earlier, there will most likely be a statistical importance, however, it is still important to verify. After the tests, I created a table with the r and p values of the variables against assists (Table 1)
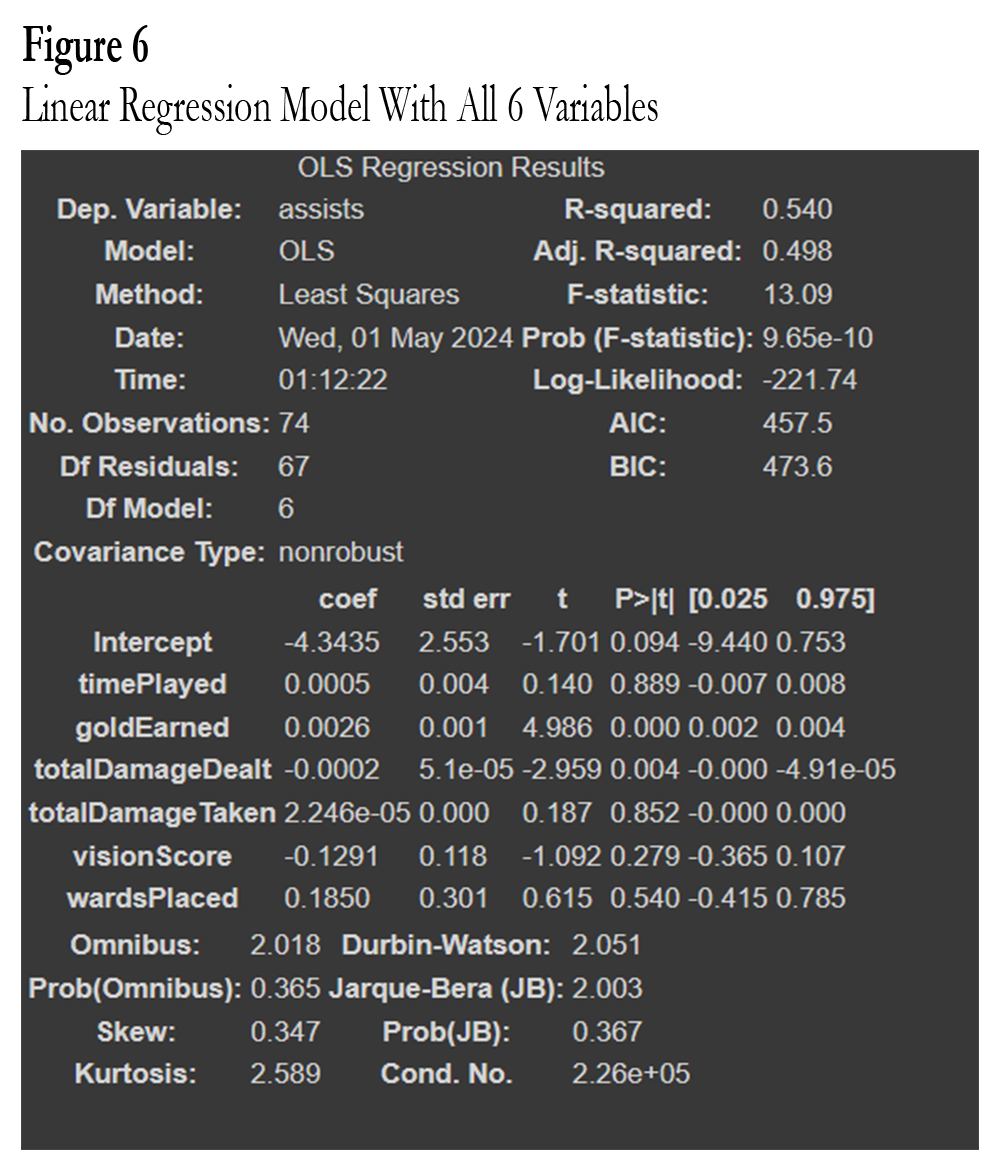
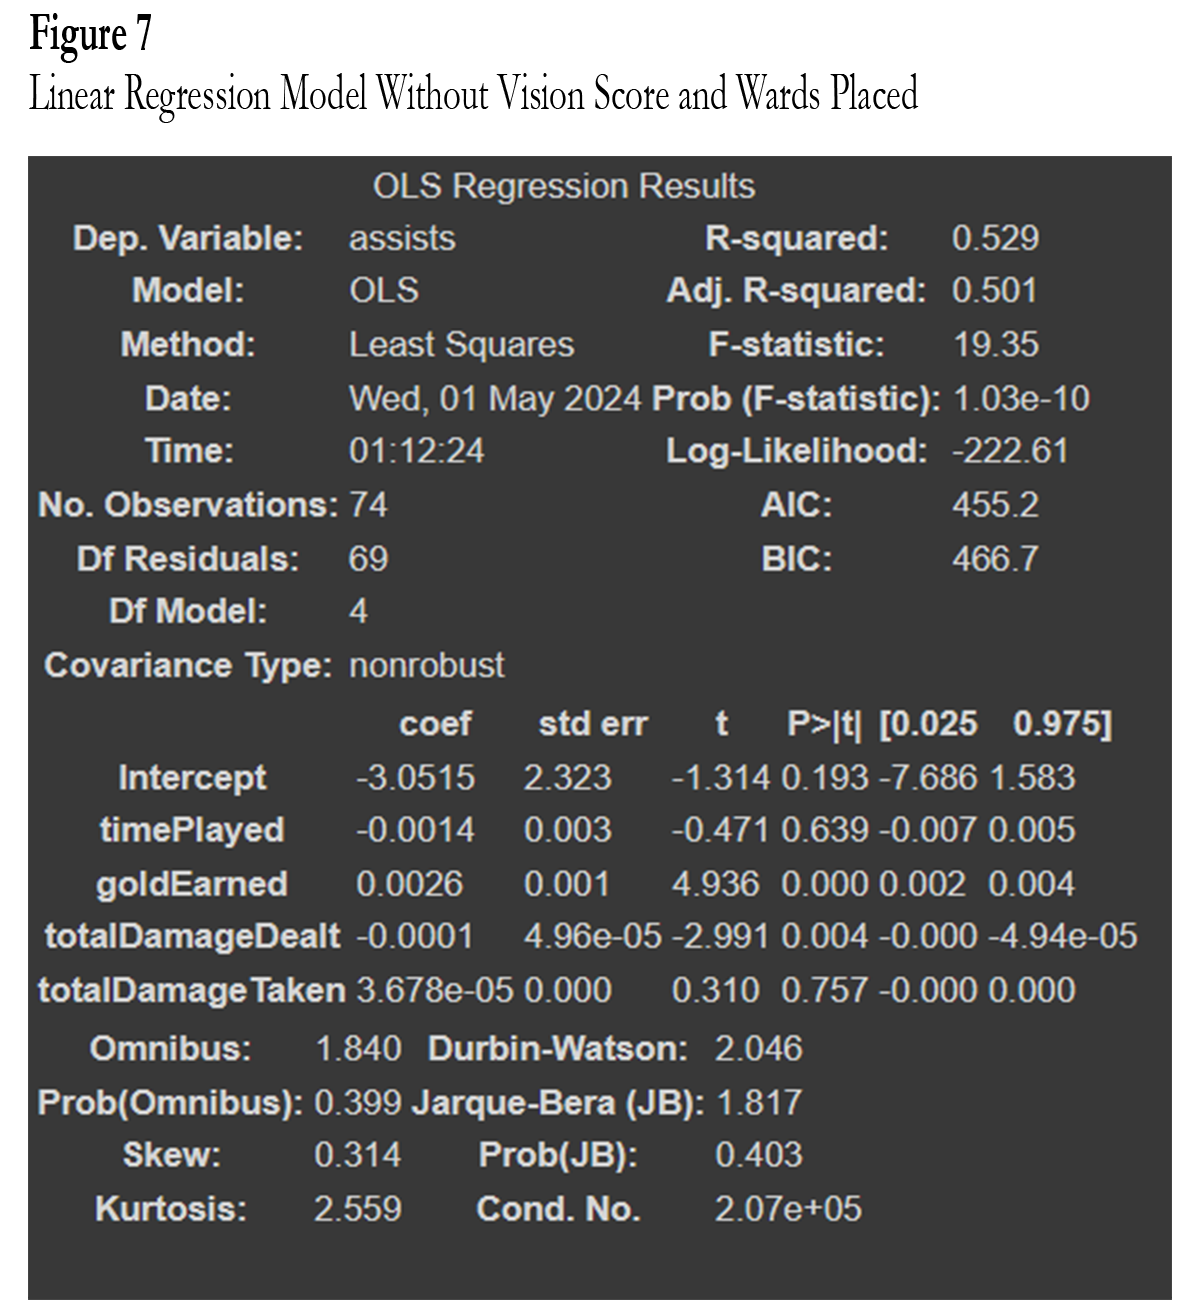
 For the linear regression model, I began by including all of the variables in the model where assists is a function of time played, gold earned, total damage dealt, total damage taken, vision score, and wards placed. This created a linear regression model with an adjusted r squared of 0.498 (Fig. 6). It is important to try other models to attempt for a better R squared. The next model is the same as the rest but with vision score and wards placed omitted as these were the weakest from earlier testing. This resulted in an Adj. R squared of 0.501 (Fig. 7) which is an improvement over the earlier model.
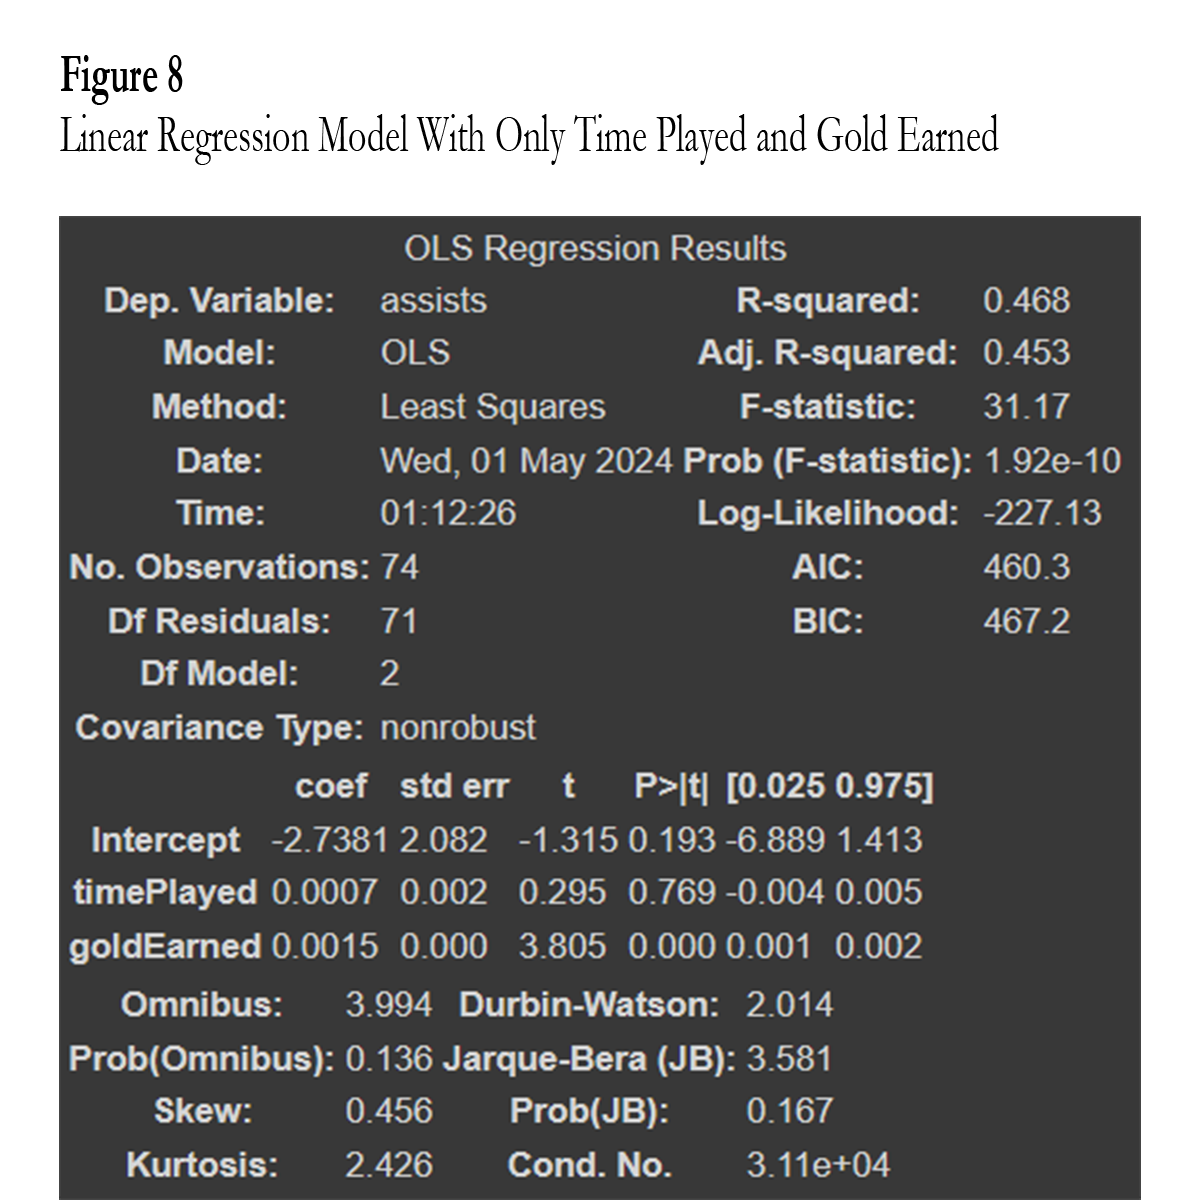
 For the next model, I tried removing the next least strong variables which were total damage dealt and total damage taken. This left a model with only time played and gold earned (Fig. 8). This model had a much worse Adj. R squared of only 0.453. This means that the strongest model was the model where assists were a function of time played, gold earned, total damage dealt, and total damage taken.
Potential Counter Arguments
From a Linear Regression standpoint, there are two weaknesses. The rst, mentioned earlier, is there is some multicollinearity. This is due to the nature of the data being so similar because of how similar League of Legends matches are. This could potentially be solved with more data but most likely not. For the next weakness, linear regression assumes no autocorrelation. However, this data is most likely auto correlated. That is because all of the observations for each match come from the same game and therefore the data for each game is correlated with each other. One of the most problematic variables for autocorrelation is how long each game is. In general, a longer game will increase all other variables. In this data set, all of the games were a dierent length. However, this autocorrelation was acceptable given that most games remain within the range of twenty to forty minutes long. Since the linear regression model fails these two assumptions, it isn’t incredibly strong. However, these assumptions aren’t nearly as important as the other assumptions and therefore the model is still statistically valuable. One of the other weaknesses to this analysis is how few matches were analyzed. There were only 74 matches that were analyzed after the data was cleaned. While more matches could have been pulled from the API, it wasn’t beneficial to the data. This is because 100 matches ago, my playstyle was different than it currently is. This is because I was in a different skill bracket than I am now. Therefore, the relationships between the data may not apply to my current playstyle.
Conclusion
The goal of this analysis was to answer the question: what components of my League of Legends gameplay contribute to getting more assists? Answering this will help me better my game play so that I may join the ranks of the best players. These answers may also help other players who play support like me to better their own gameplay. League of Legends is a globally recognized esports title that brings in millions of dollars of revenue for many players. It is not just another game and by getting good, one can unlock potential doors for success. After pulling data from the Riot API, cleaning the data, analyzing the data, and creating a linear regression model, the original question has been answered. The answer to the question is: an increase in time played, gold earned, total damage dealt, and total damage taken has a positive impact on the number of assists I get. Therefore, if I want to improve my games, I should look to increase these variables. Prolonging the game makes sense as the longer I play, the more assists I should get. As for dealing more damage, I should try to play support champions with a high damage output and poke in lane as much as possible. As for earning more gold, I can prioritize poking in lane, getting objectives, and farming when appropriate. Taking more damage may seem hindering but the data shows that it helps with getting more assists. This may be because being aggressive usually causes one to take more damage. Therefore, I should try to engage the enemy and poke more often even if it causes me to take more damage. Overall, after this data analysis, I have a better understanding of what components of my gameplay help me to get more assists. Improving these components will in turn make me a better support. I will implement these changes into my gameplay and could possibly do a follow up analysis to see if the results were accurate.